
All work/Project 01 · 仕事

PV-
Dashboard

Category
Monitoring for the company’s photovoltaic system
Type
Part-time · Plant engineering
Year
2025 – 2026
Status
Live
Read the article

Two inverters, the building controller’s meter readings and the weather forecast in a single interface, running entirely on the local network with no vendor portal and no cloud.

/01 · Realtime

One view instead of three portals

Operating data for the photovoltaic system was scattered across three places: two inverters, each with its own web interface, the meter readings inside the Homematic building controller, and no weather context at all. Anyone who wanted to know how much energy was generated, self-consumed and fed into the grid had to open three sources and do the arithmetic in their head.

The dashboard solves this by collecting every source server-side, normalising it into a single data model and exposing it as a REST API. A React frontend sits on top, reachable from any browser on the company network: no installation, no vendor account, no data leaving the building.
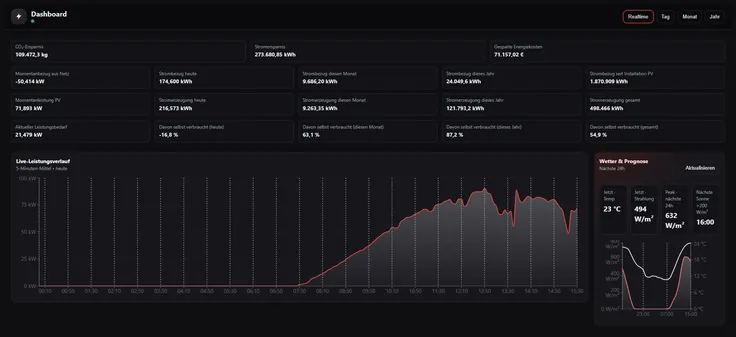
Realtime · live values, live power curve, weather and forecast
/02 · Architecture

The backend talks to the hardware, the frontend only to the API

I built this project end to end and on my own: requirements, reverse-engineering the device interfaces, data model, backend, frontend and operations. Colleagues were consulted on isolated technical questions only. Architecture, technology choices and implementation were mine throughout.

That included the unglamorous parts: working out which endpoints the devices actually expose, in what format and at what interval they respond, and what happens when one of them doesn’t.

An unfamiliar stack. My background is systems administration, not application development. I taught myself Node, React and the surrounding toolchain over the course of the project. The goal from day one was a system that runs in production, not a prototype.

BrowserReact · ViteRechartsBackendNode · ExpressREST · cacheInverters WR1, WR2HTTP · CSVlive · day · month · yearHomematic CCUXML APImeters · feed-inOpen-MeteoHTTPShourly forecastREST APIfixed intervalserved from cache
Only the backend talks to the hardware. Load on the inverters and the CCU stays constant however many dashboards are open.

How I built it

FrontendReact · Vite · Recharts
BackendNode.js · Express (ES modules) · REST API
Sources2 inverters (HTTP, CSV) · Homematic CCU (XML API) · Open-Meteo (HTTPS)
OperationsDocker · company network only
/03 · Day

Three time resolutions on one axis

Three interfaces, three data worlds. CSV over HTTP, XML from a building controller, JSON from a public weather API: none of them designed for this purpose, none following a shared convention. The real work was not fetching the data but normalising it into a model the frontend could consume without special cases.

Mismatched time resolutions. Live values arrive every few seconds to minutes, inverter aggregates by day, month and year, the forecast hourly. Putting these on one axis requires careful handling of time zones and daylight-saving transitions. Otherwise you get gaps or duplicate points on exactly the two days a year nobody tests for.

Devices are not always reachable. Inverters return no meaningful values at night and the CCU disappears briefly on restart. A failure in one source had to leave the remaining panels intact, which meant per-source fault tolerance instead of one shared failure path.

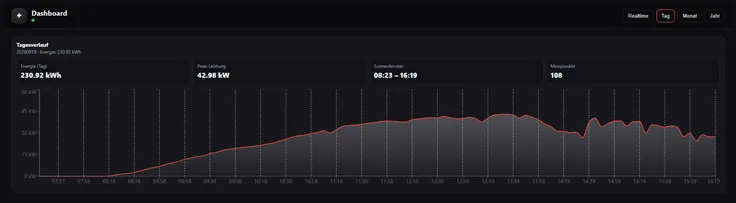
Day · daily curve with energy, peak power and sun window
/04 · Month

Anomalies surface early, not at the next settlement

Meter logic, not just number display. Self-consumption and self-sufficiency only emerge from peak/off-peak meters, the feed-in meter and instantaneous grid power once signs are handled correctly and meter readings are properly distinguished from instantaneous power. A sign error is especially treacherous here, because the result still looks plausible.

Protecting the hardware. A browser request must never translate into a device query. The backend polls on a fixed schedule and serves from cache, keeping load on the inverters and the CCU constant regardless of how many dashboards are open.

  • Anomalies surface early. Yield drops, a failed string or a stalled inverter become visible immediately instead of at the next settlement.
  • Forecast as context. A weak day can be checked against the forecast straight away, separating low irradiance from an actual fault.
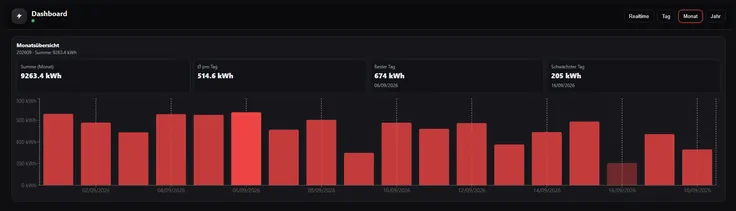
Month · yield per day, best and weakest day
/05 · Year

No cloud, no licence costs, an extensible base

  • One view instead of three portals. Generation, grid draw, feed-in and self-consumption sit side by side for the first time. “Is the system performing as expected?” is now a few seconds of looking rather than several navigation paths.
  • No cloud, no licence costs. All data stays on the company network. There is no dependency on a vendor portal and no recurring cost.
  • An extensible base. The REST API was deliberately built as a standalone interface and can serve further analysis, exports or integrations without touching the frontend.
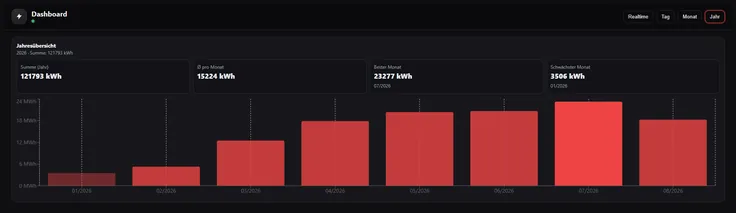
Year · yield per month
/Next project · 次へDokumenten-WorkflowDocument intake on open-source components, archived audit-proof